 .
.Kanzi Studio enables you to analyze and debug your application in several different ways.
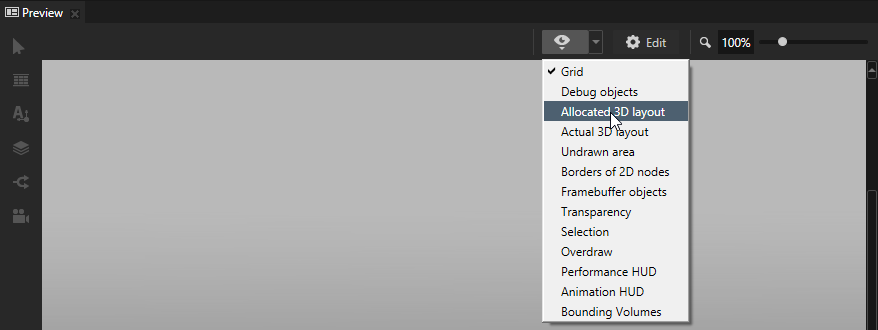
In the Preview use the Visualize mode to see the performance information for your application and various debug objects, such as layouts, and bounding volumes.
To switch the Visualize mode on and off, in the Preview click .
When in the Visualize mode, use the drop down menu to select what you want to view in the Preview.
Learn about debugging in the Preview >
The Log window shows events logged by Kanzi Studio including:
To open the Log window in the main menu select > Log. When the Log window is closed you can see the latest log message in the Status Bar.
You can find all Kanzi Studio log messages in %USERPROFILE%/AppData/Local/Temp/KanziStudioLogs. If you encounter a problem with Kanzi Studio, when contacting the technical support, send the log files along so that the technical support team can pinpoint and help you solve the problem.
For technical support go to Kanzi Support Portal at http://support.rightware.com/ or send an email to kanzi.support@rightware.com.
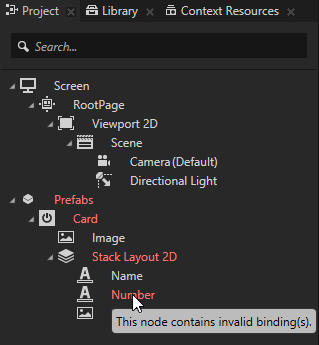
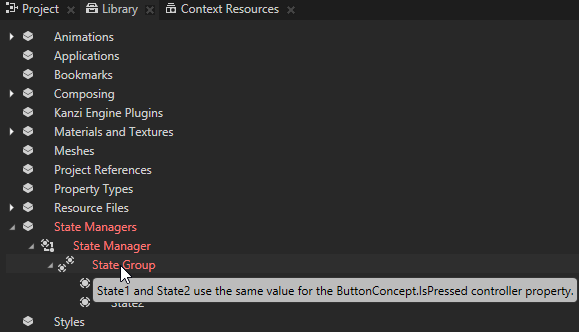
Kanzi Studio color codes nodes, resources, and properties:
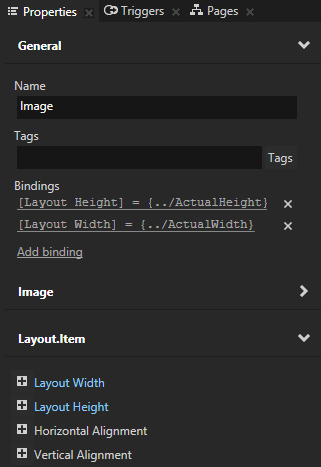
When you need a brief explanation on what a property does, move your mouse pointer over the name of that property.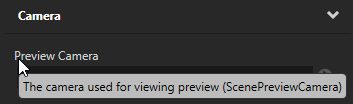
If you want to get more information about an item in your project, such as what a Viewport 2D or a Delta Node is used for, select an item in the Project, Nodes, or Library windows and in the Properties click  or press F1.
This opens the Kanzi documentation in your default browser.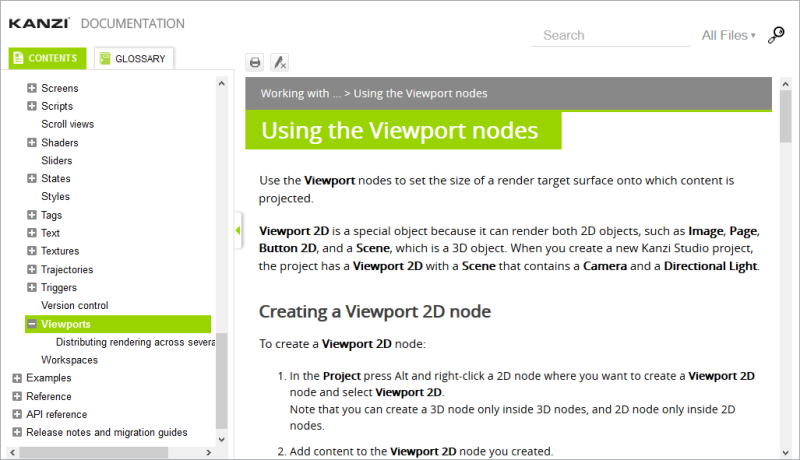
For technical support go to Kanzi Support Portal at http://support.rightware.com/ or send an email to kanzi.support@rightware.com.
Now that you covered the basics of working with Kanzi, Learn about Kanzi:
